A bird's-eye view of variable stars in clusters
Stars, Star Clusters, Paper Summaries
18 August 2025 | Reading time: 3 minutes
What happens when you combine Gaia DR3’s variable star classifications with the latest catalogue of open clusters? In a new paper with Richard Anderson at EPFL in Switzerland, we did just that!
The sample
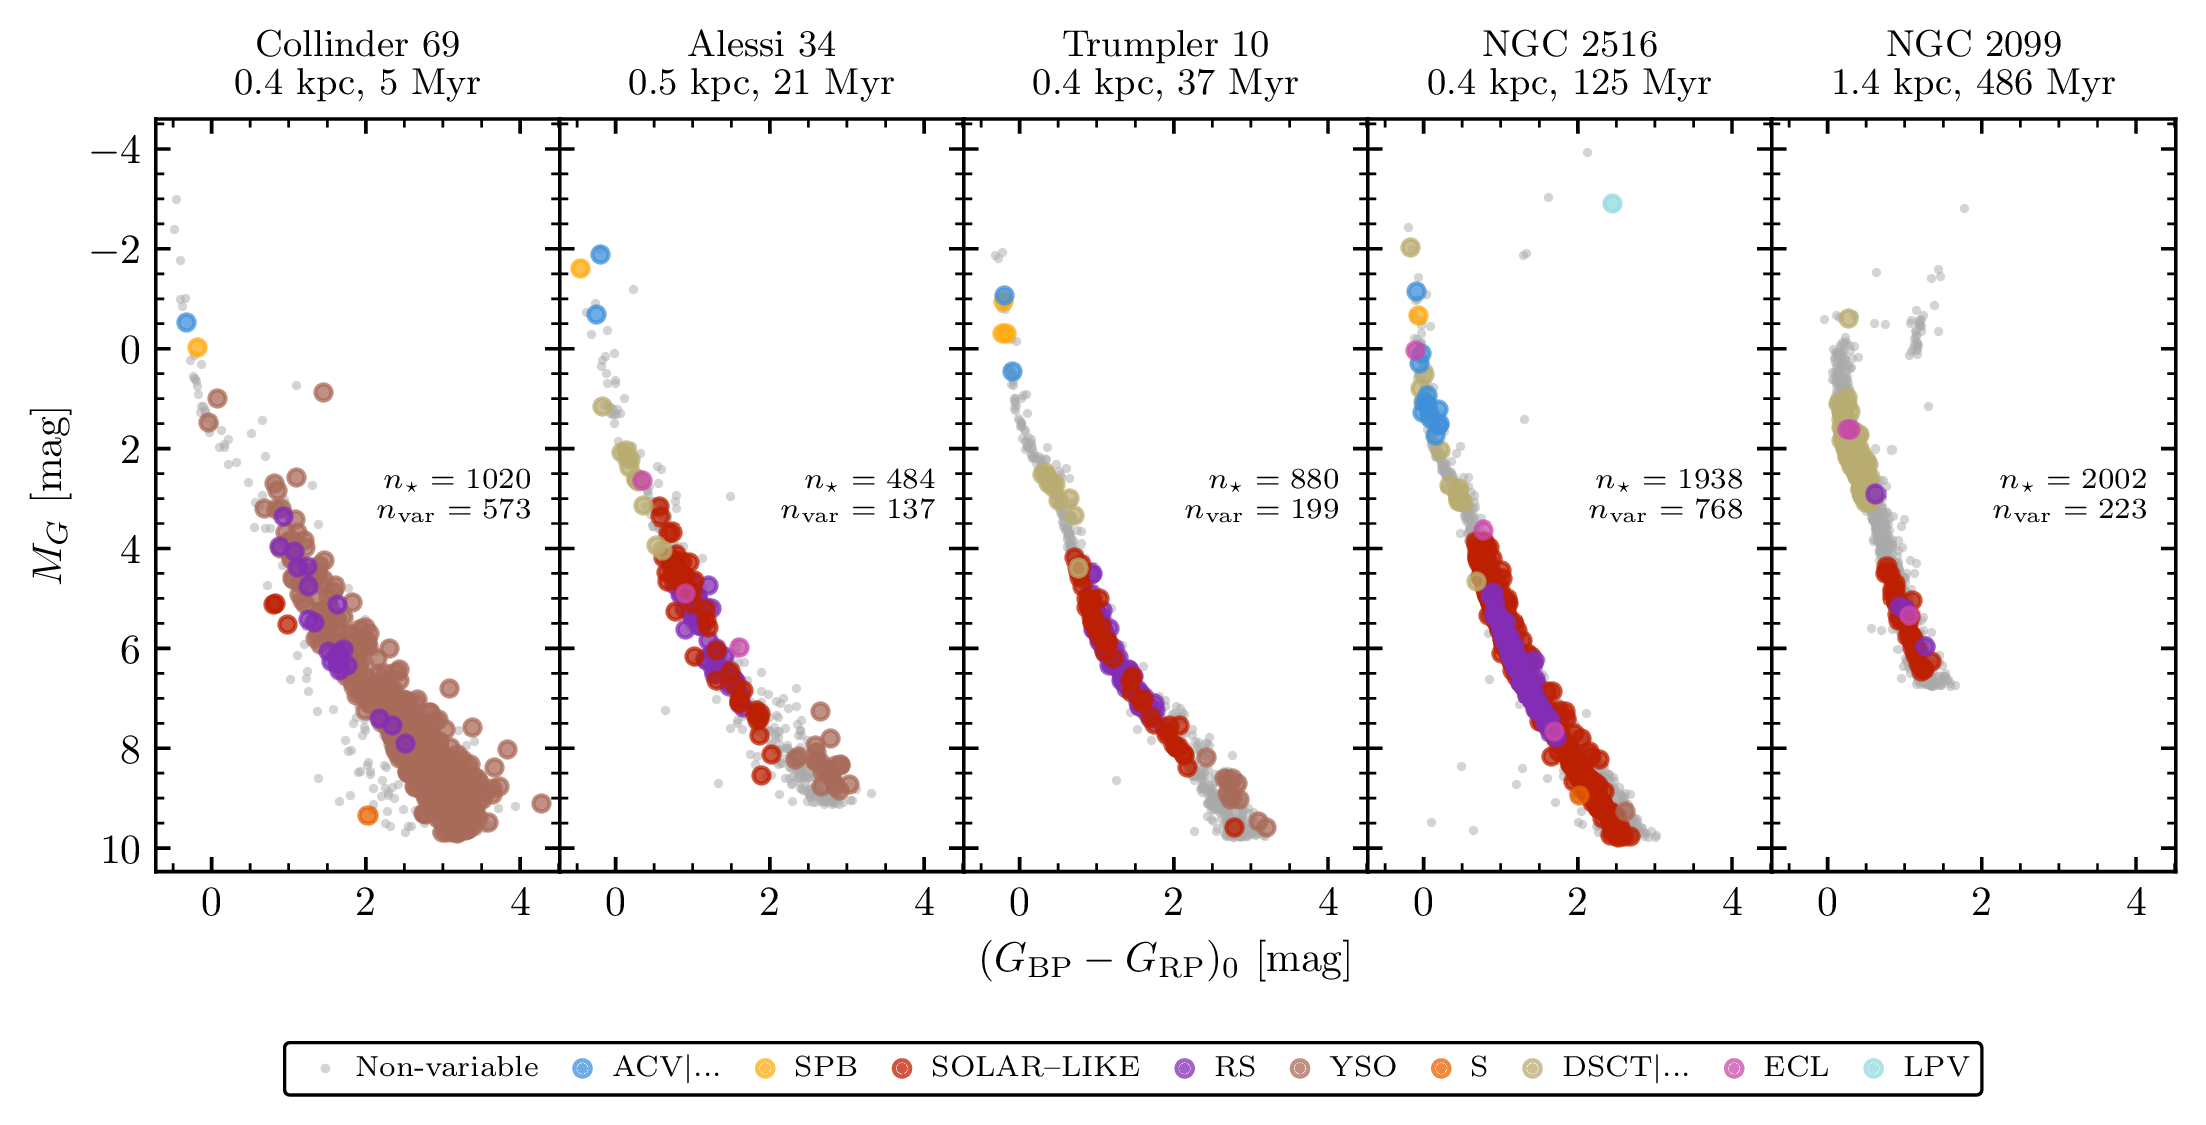
We started out by selecting 1192 well-populated, nearby, and minimally reddened open clusters from my catalogue. Pretty much immediately after joining my catalogue and Gaia DR3’s variability classifications together, it’s clear that almost every cluster has variables - especially the youngest ones! And as clusters age (left to right in the below), their variable content evolves too.

The best ever empirical Hertzsprung-Russell diagram for variables
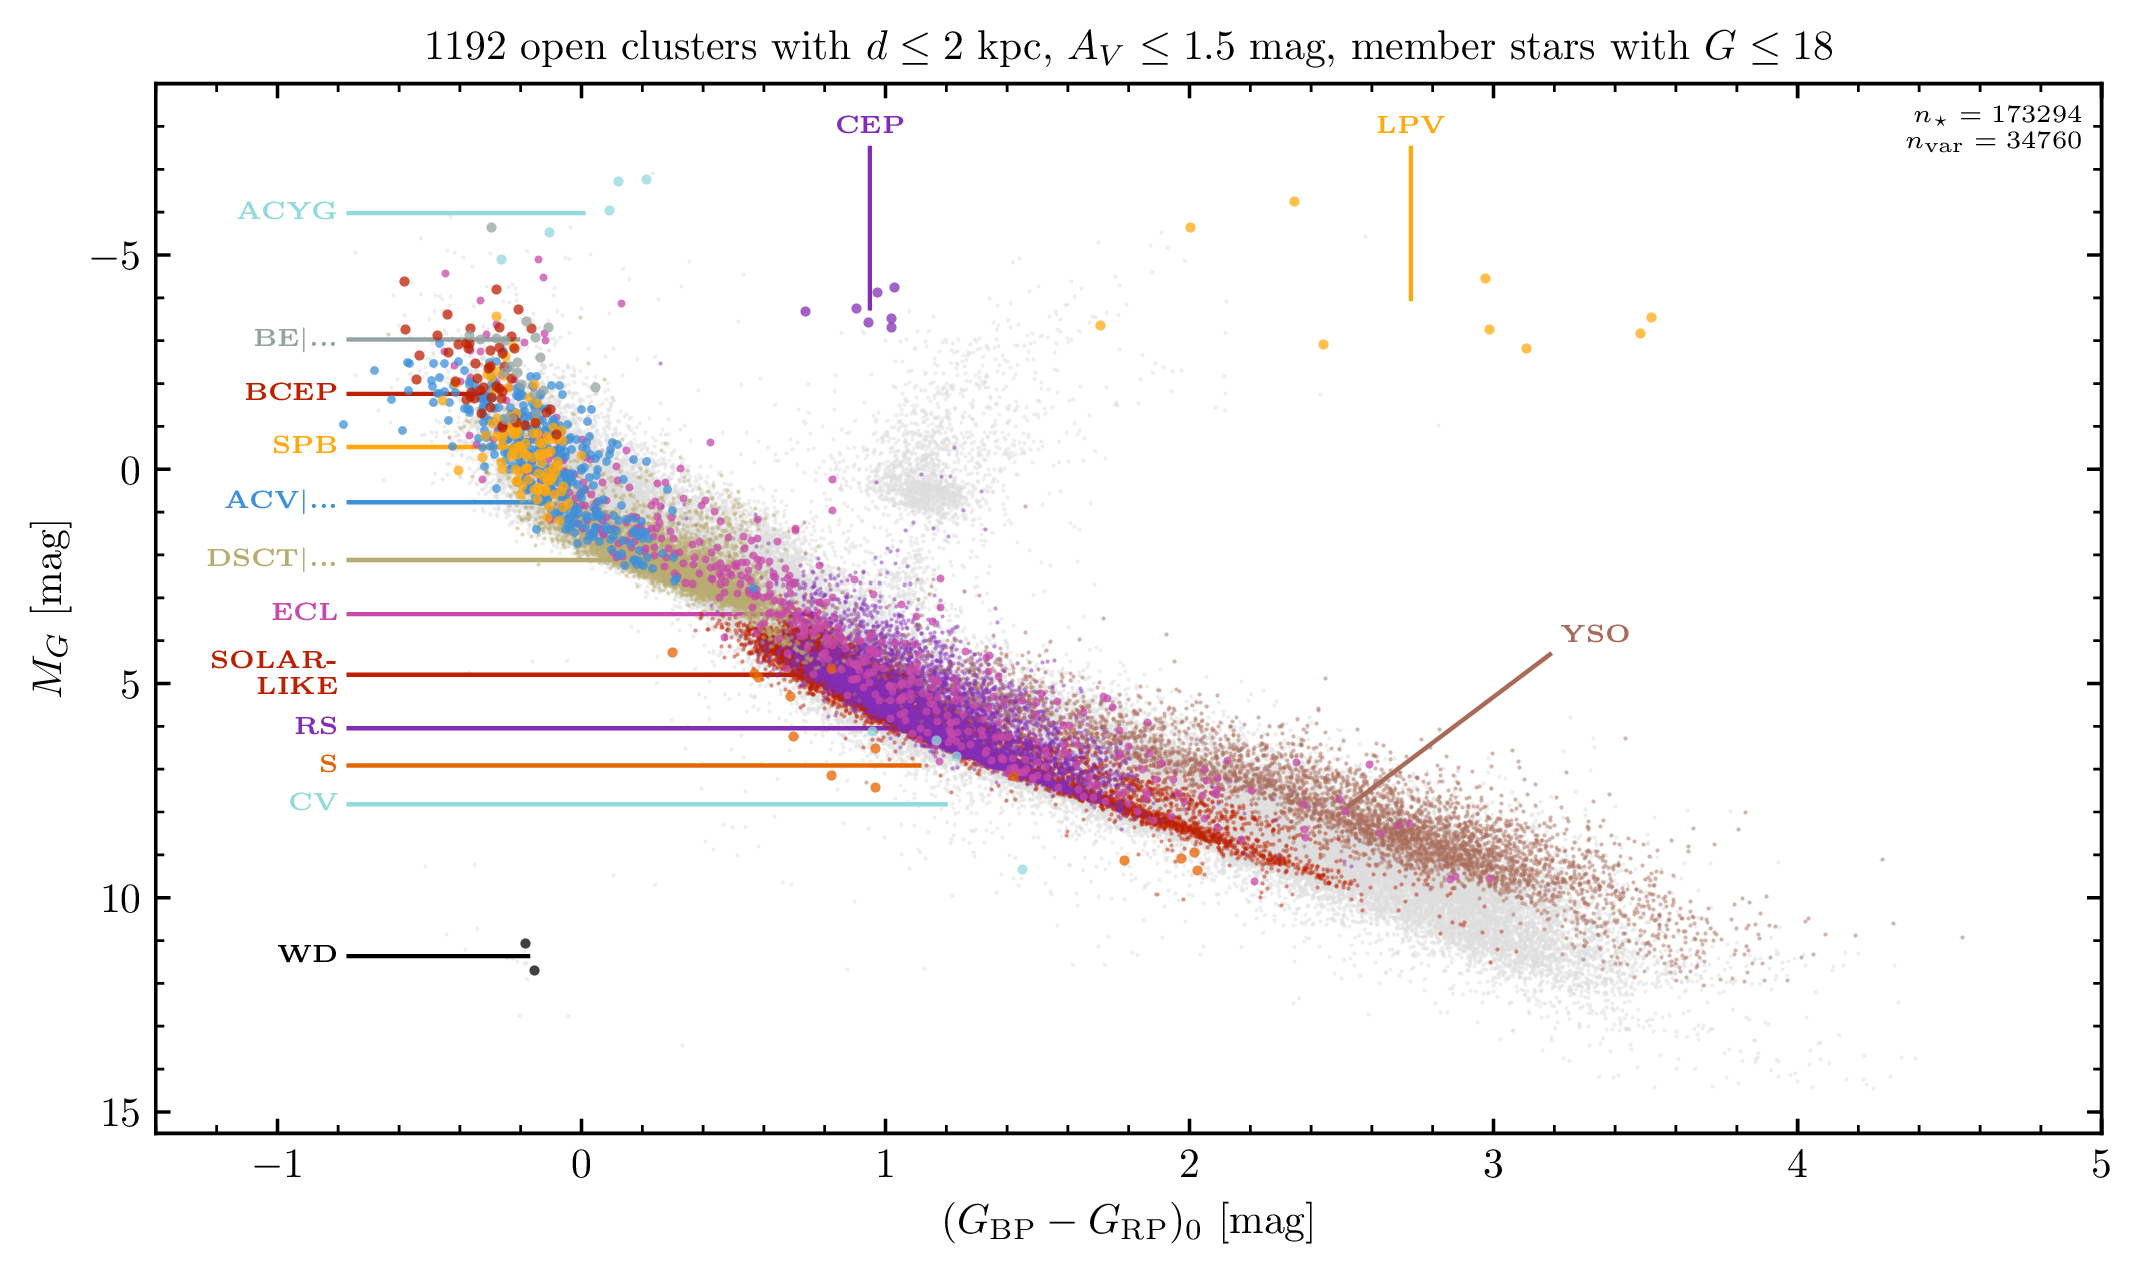
To look at this evolution further, we set out to analyse the full population of 34,760 variable stars in a Hertzsprung-Russell diagram (HRD), which is a pretty common way to compare variable stars. But the great thing about working with star clusters is that they have better parameters than field stars. Hence, we were able to put all stars on a precisely dereddened Hertzsprung-Russell diagram — the most precise empirical one ever made for variable stars!

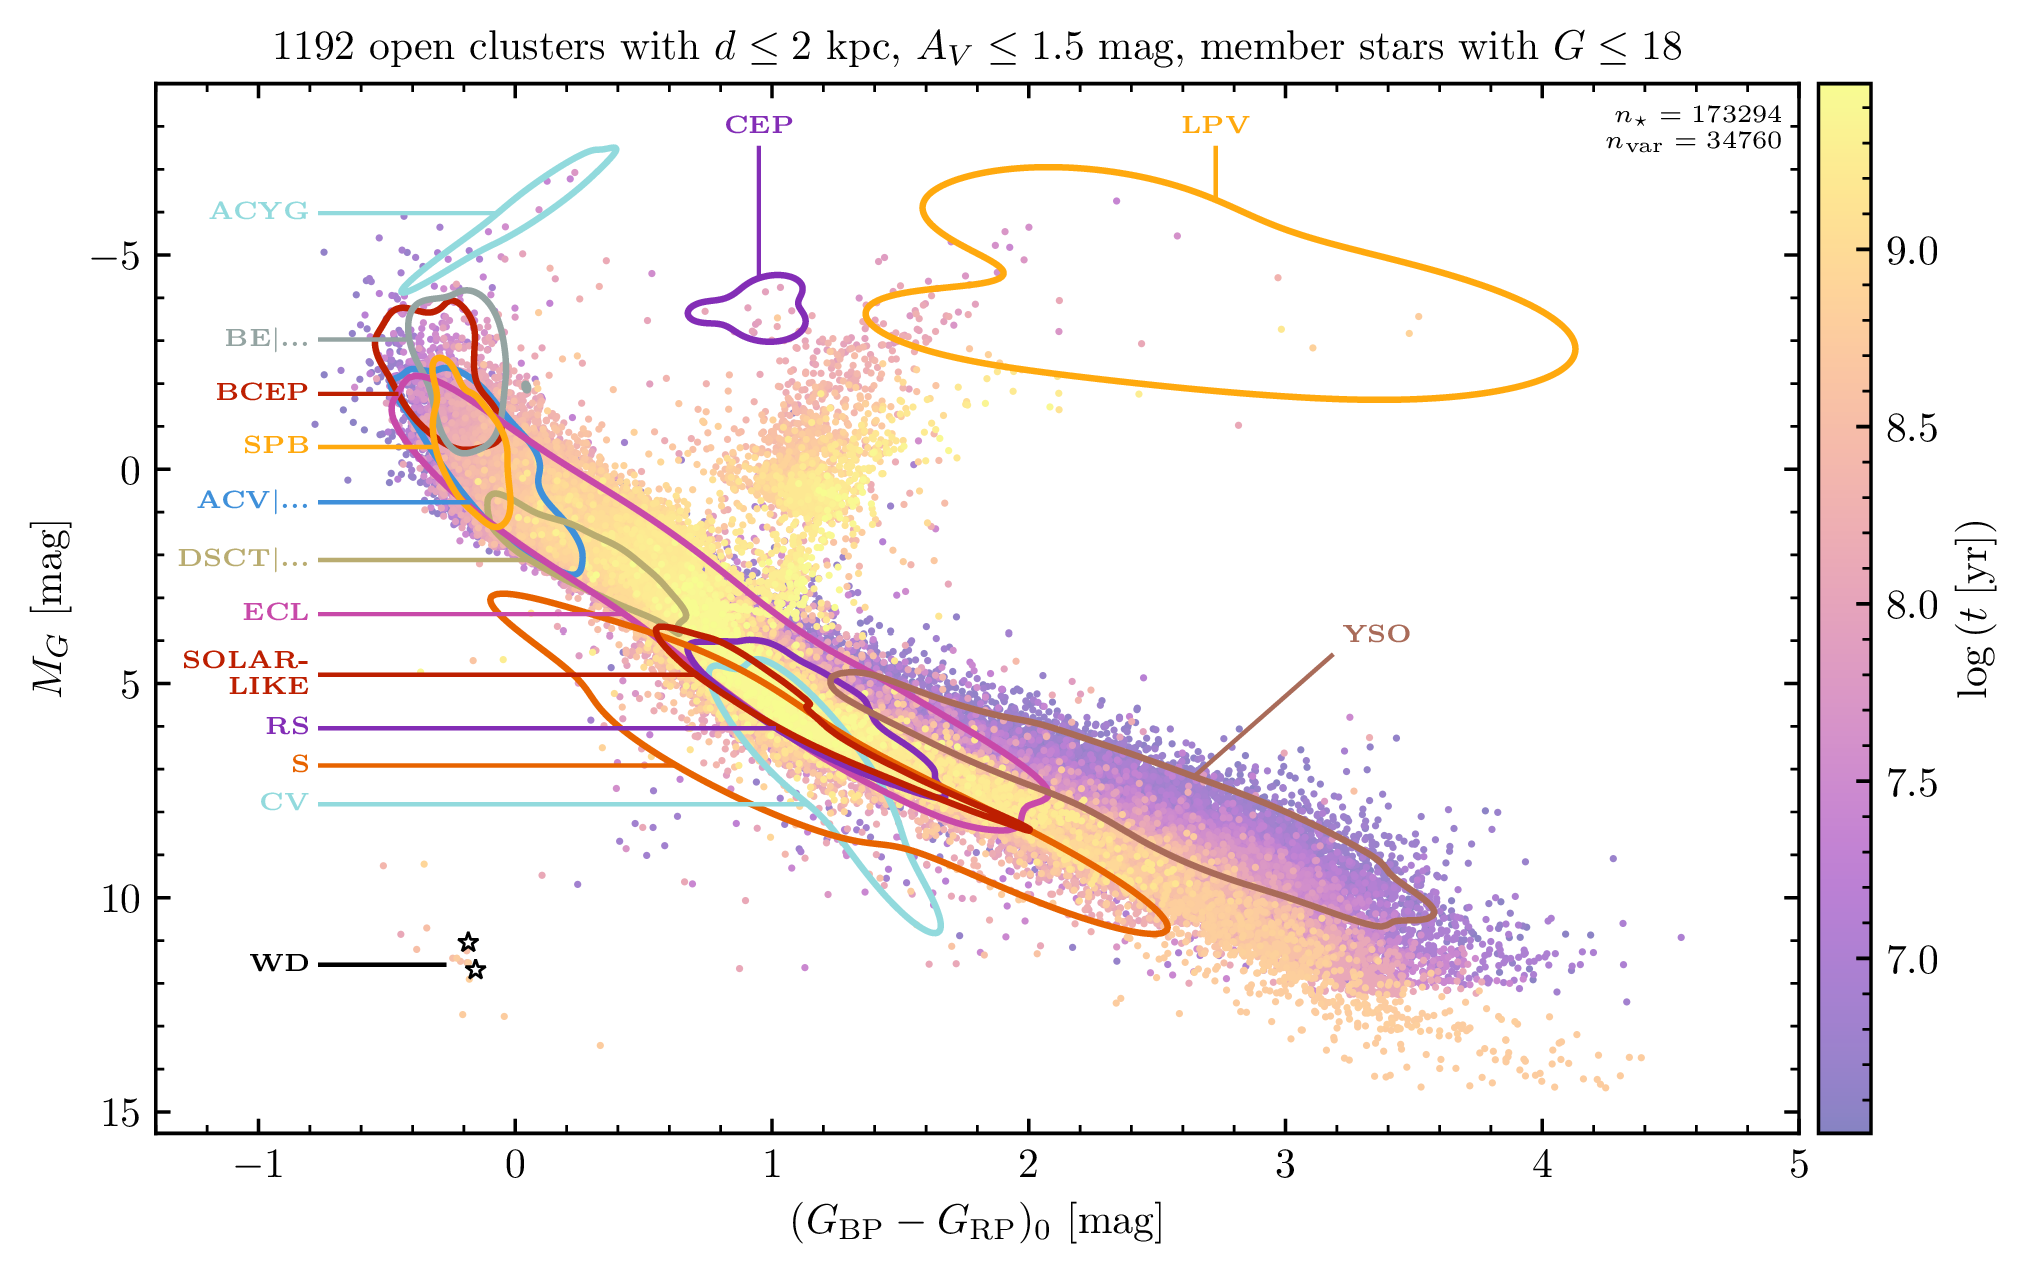
Here’s another version with regions of variability that we derived empirically shown instead of individual stars, and with stars colour-coded instead by their age.

There are tons of things to unpack here and that we get in to in the paper — after all, there are variable stars in almost all parts of the HRD. But the shapes of those variability regions can be very different: some, like alpha Cygni (ACYG) and classical Cepheids (CEP), have very small instability regions on the HRD, meaning that only a very particular stellar mass and phase of stellar evolution undergoes that kind of pulsation. Other types of variability, such as long-period variables (LPV) or eclipsing binaries (ECL), appear across a much larger region. Without precisely dereddening these stars, it wasn’t previously possible to see such large differences in the size of these regions.
Variability and age
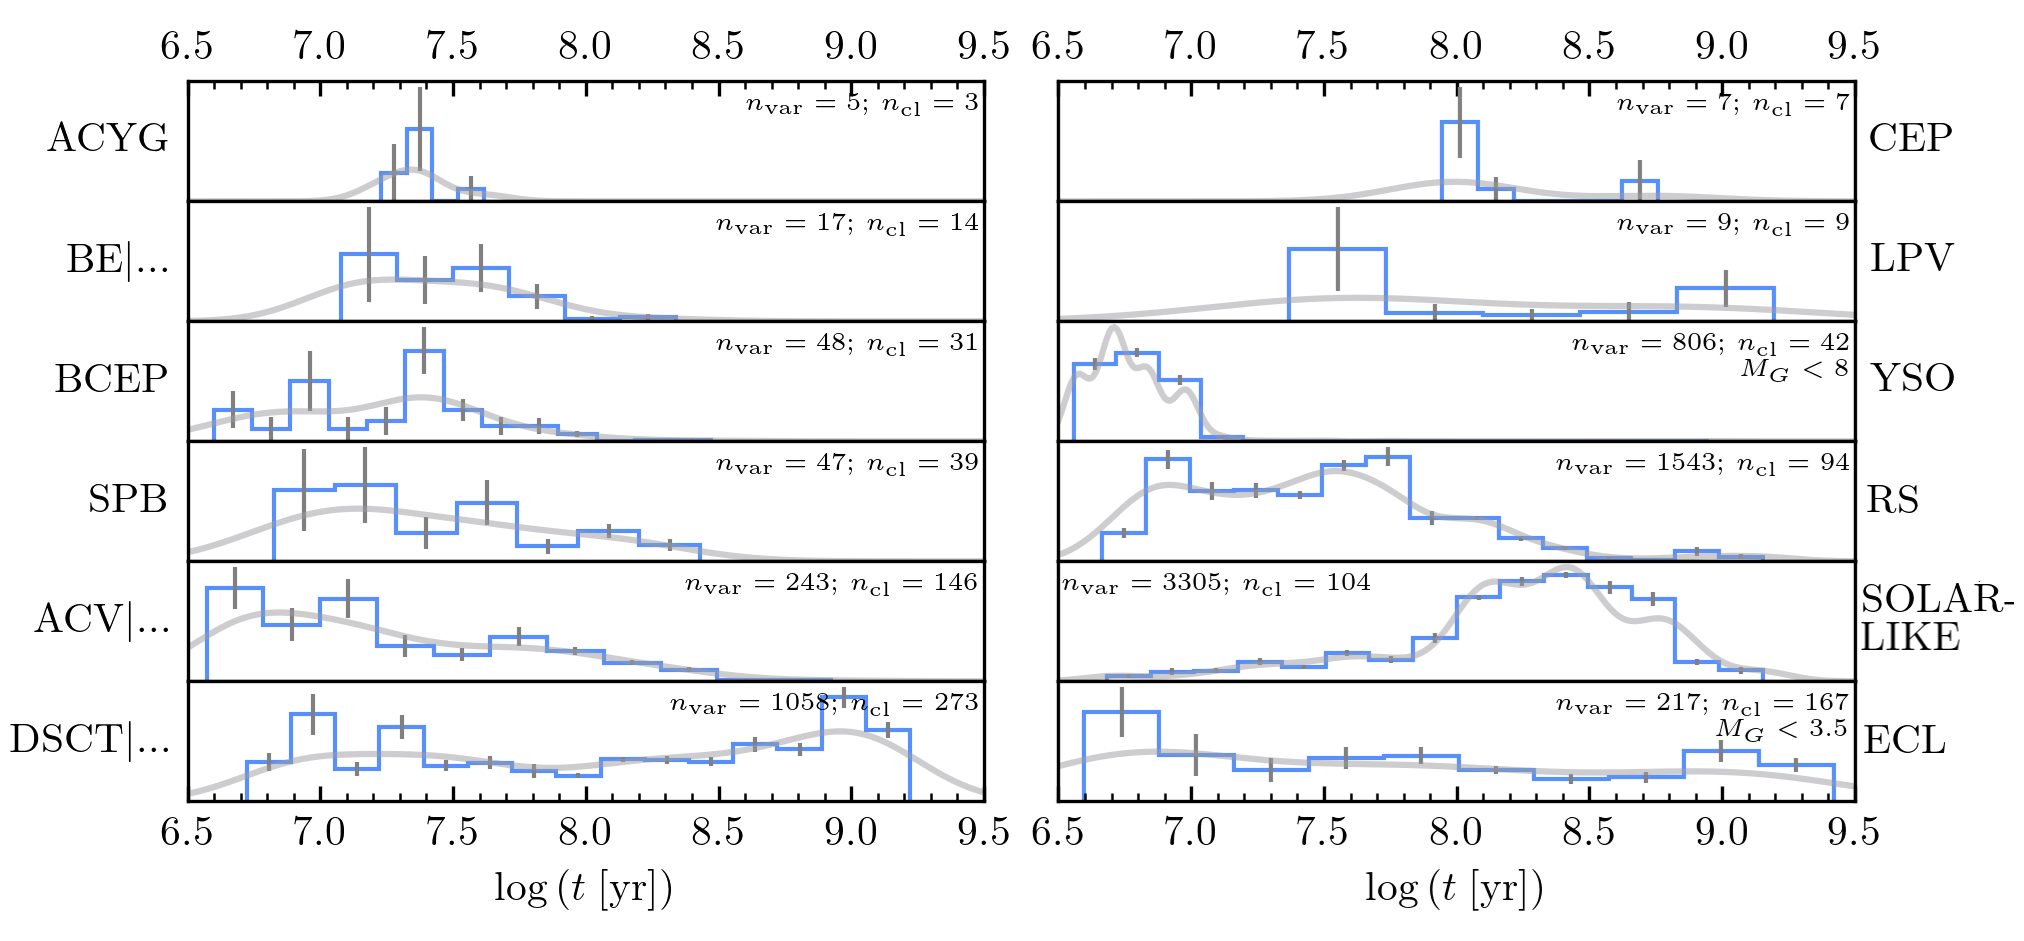
Next, taking advantage of precise age estimates available for clusters, we looked at how the occurrence of variables changes with age! Some types of variable (like YSOs and ACYG) exist at very specific ages only, while others (like eclipsing binaries/ECL) exist at all ages more or less uniformly.

The histograms (blue) and kernel-density estimates (grey) show how certain variables happen only at certain ages (like ACYG and CEP), whereas others occur roughly uniformly (like the delta Scuti & similar stars group, DSCT). We suggest that simple ratios of variable classifications could be used as a way to empirically age-date clusters in the future.
We also looked into some of Gaia DR3’s gyrochronological data (i.e., activity and rotation rates of stars), finding relations consistent with literature predictions. Future data releases will have a lot more to say, there.
About the future
In my opinion, the most exciting thing about the paper is what we expect will be possible with Gaia DR4 - coming out ~16 months from now! DR4 will contain ~10x as many variable star classifications in ~4x as many classes, and will have epoch photometry for all sources - not just variables. It will be possible to do a lot of really amazing empirical analysis of how stars vary as they evolve within clusters, and this paper is just the start of what we have planned. And that’s not to mention that the LSST will start churning out data releases soon too. So stay tuned — variable stars in clusters are only going to get more exciting!